struct individual {
  int allele;
  int phenotype;
  double fitness;
};
| ALT | Altruist allele (=2) |
| SELFISH | Selfish allele (=1) |
| EMP | Empty, the site is not occupied by any individuals (=0) |
popB=calloc(popSize, sizeof(struct individual));
Fitness of an individual
| Altruist | 1 + gBenefit * p - gCost |
| Selfish | 1 + gBenefit * p |
| Empty | gColonizationDifficulty |
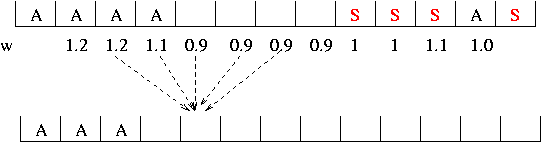
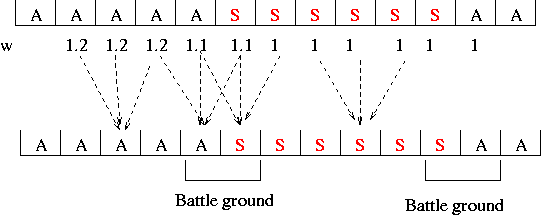
p is the frequencies of altruist in the neighbor (defined by gNeighborSize).
Actually, all of the fitness was divided by 1 + gBenefit - gCost (the maximum possible fitness when gBenefit > gCost) to make it between 0 and 1.
| population size | 200 |
| Initial Frequency | 0.5 |
| neighbor size for altruistic behaviors | 100 |
| Maximal dispersal of offspring | 100 |
| Benefit (b) | 0.6 |
| Cost (c) | 0.2 |
| ``Fitness'' of empty site | 0.95 |
| Probability of population disturbance | 0 |
| Damage (fraction of population size) | 0.1 |
Hint: Set NeighborSize to 1, varies the cost from 0.1 to 0.3. 50:50 chance of winning when cost is around 0.2.
To plot, how spatial distribution changes,
R

> source("/home/progClass/src/altruism/altruism.r")
> plot.altruism("altruism.spatial.out")
altruism.spatial.out is the output of the program which shows the changes of alleles at each site. This output is only from the first repetition.
Low dispersal distance:
neighbor Size = 1
disperal = 4
gTragedyFreq = 0.1
Wow!! Take a look at the changes in allele distribution. Think why this make such a big differences.
Even with higher cost (0.22), Altruist can win.