Here we will look at how to write perl scripts which interact with other programs.
#!/usr/bin/perl -w

system("date");

my $cmd = "ls";
my $opt = "-l";
my $arg = "/";

system("$cmd $opt $arg");

exit;
The output of the shell commands will go to the output of the perl
script. By default, it is the screen, i.e. STDOUT, but you can
redirect it with > (e.g. shellCmds.pl > output).
$PATH).
system('echo $PATH');  # Works with single quotes
system("echo $PATH");  # Perl thinks that $PATH is a perl var
                       #  because " " causes interpolation.
system("echo \$PATH"); # Escaping $ works.
ls /
echo $?

ls /nonExistingDirectory
echo $?
$? contains the exit status of
previous command.
my $status = system("date");  # it will be 0

! system("ls /nonExistingDirectory") || die "Can't run ls\n";
`).
my $now = `date`;
if ($now =~ /(\d\d:\d\d:\d\d)/) {
  print "Current time is $1\n";
}
It is similar to system() with double quotes. The
variables are expanded.
my @result = `ms 4 2 -t 4`;
foreach my $line (@result) {
   print "$1\n" if ($line =~ /^segsites:\s+(\d+)/);
}
ms 30 4 -t 3.0 | sample_statsprints out:
pi:	4.232	ss:	13	D:	0.956	thetaH:	3.285	H:	0.947
pi:	1.314	ss:	5	D:	0.114	thetaH:	0.478	H:	0.836
pi:	2.540	ss:	8	D:	0.783	thetaH:	1.942	H:	0.597
pi:	2.726	ss:	14	D:	-0.762	thetaH:	1.549	H:	1.177
These different summary statistics represents different aspects of genealogy which created the sequence data.
Create a perl script (cleanSampleStats.pl), which will read in the output of sample_stats, and convert the format to a nice tab-delimited numbers. i.e., the output should look like:
pi:	ss:	D:	thetaH:	H:
4.232	13	0.956	3.285	0.947
1.314	5	0.114	0.478	0.836
2.540	8	0.783	1.942	0.597
2.726	14	-0.762	1.549	1.177
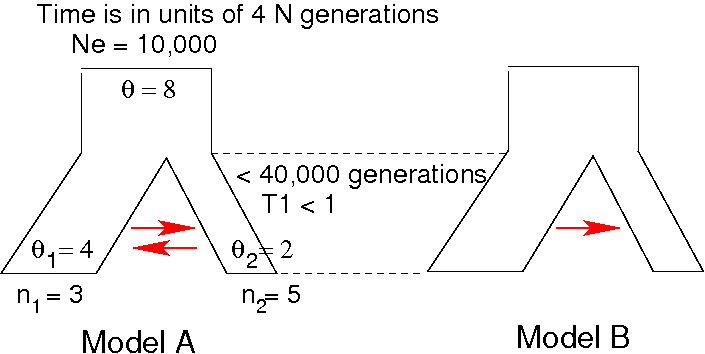
We are wondering whether the migration is one directional.
We want to run coalescent simulations under two different models, and look at the results of simulation to see whether the observed sequence data fits one of the model better.
rand(max)rand(9.5) returns a random number x:
Try this:
my $upper = 1;
my $lower = 0.01;

for(my $i = 0; $i < 15; $i++) {
  my $thisRandNum = rand($upper - $lower) + $lower;
  print "$thisRandNum\n";
}
ms 8 1 -t 8 -I 2 3 5 -ma x 8.0 16.0 x -n 1 0.5 -n 2 0.25 -en $T1 1 1.0 -ej $T1 2 1
tail -> Simulate Model B
Use the migration matrix:
-ma x 8.0 0.0 x
The final output will look like:
M	T1	pi	ss	D	thetaH	H
0	0.605	2.07	6	-0.48	1.35	0.71
0	0.034	18.75	40	1.15	17.53	1.21
1	0.045	8.32	24	-0.53	5.67	2.64
:	:
:	:
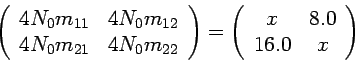
![]() is the fraction of subpopulation i which was in the
j-th subpopulation in the previous generation.
is the fraction of subpopulation i which was in the
j-th subpopulation in the previous generation.
Instead of setting the migration rate to a pre-fixed value, modify the program to estimate the migration rate (in addition to divergence time). In other words, you need to draw the migration from a random distribution.